 MrGripper
The short answer
One hand can produce a lower grip reading because hands are not perfectly symmetrical and because small changes in testing can affect the result. In a 2025 research review, the dominant hand averaged 8.1% stronger for grip. But another 2025 study found 32.3% of its 229 participants were strongest in their non-dominant hand. Repeat the same test before interpreting the gap.
The useful question is not “Are my hands identical?” It is: Does the same hand keep testing lower when the device, position, and trial format stay the same?
Is it normal for one hand to have a weaker grip?
Yes. Equal strength is possible, but it is not the only normal pattern.
A 2025 review synthesized 87 studies of upper-limb strength asymmetry. In the grip-strength data, the dominant hand averaged 8.1% stronger than the non-dominant hand, while the right hand averaged 6.3% stronger than the left. Those figures describe groups. They are not a personal pass/fail line.
Dominance does not reliably predict which hand will win your test. A separate 2025 study of 229 middle-aged adults found that 74 participants—32.3% of the sample—recorded their highest result with the non-dominant hand.
So a left–right difference can exist without telling you why it exists. If you want a deeper explanation of common percentage cut-points, read our guide to grip strength symmetry.
Why can one hand produce a lower reading?
Your hands do different work
“Dominant” usually means the hand you prefer for a task, not the hand that must be strongest in every movement. Work, sport, tools, carrying habits, and training can load the two sides differently. That makes handedness a clue, not an answer.
The test changed between hands
Grip results are only comparable when the test is comparable. Research protocols vary in the dynamometer used, body position, elbow and wrist position, handle setting, number of attempts, rest time, and whether the best or average result is recorded.
If one hand is tested with a neutral wrist and the other with the wrist bent, you have changed both the hand and the test. The reading alone cannot separate those effects.
The attempts were not equally fresh
Trial order and rest are part of the protocol for a reason. Repeated maximal squeezes are not identical attempts, so rushing one side or testing immediately after grip-heavy activity makes the comparison harder to interpret.
This is why one pair of readings is weak evidence. First make the measurement repeatable. Then watch whether the pattern repeats.
How do you compare both hands more consistently?
Use a simple, repeatable protocol:
- Use the same dynamometer. Do not compare readings from different devices.
- Keep your position the same. Sit in the same chair, keep your elbow at about 90°, and keep the forearm and wrist neutral.
- Use the same handle setting. A different grip span changes the task.
- Take 3 attempts per hand. Alternate hands rather than completing every attempt on one side first.
- Use the same rest interval. One published 2025 protocol used 30 seconds between trials; consistency matters more than pretending one interval fits every context.
- Choose one scoring rule. Record either the best attempt or the average, then keep that rule for future tests.
- Repeat on another rested day. Keep the device, position, order, and scoring rule unchanged.
The 2025 study in which 32.3% of participants were strongest in the non-dominant hand used a seated position, a 90° elbow, a neutral wrist, 3 trials per hand, alternating sides, and 30 seconds of rest. It recorded the best result from each hand. That is one documented protocol, not a universal clinical standard.
For a full walkthrough, see how to test grip strength at home.
How should you read the pattern?
The pattern across repeat tests is more useful than a single percentage.
| What you see | What the measurement supports | Next measurement step |
|---|---|---|
| Small gap that stays similar | A repeatable individual difference | Keep the protocol unchanged and track the trend |
| Gap disappears on the next test | The first comparison was not repeatable | Check position, effort, order, and rest |
| Different hand wins from test to test | The difference may be close to normal test variation | Collect more comparable sessions before drawing a conclusion |
| Same hand repeatedly tests lower | A consistent asymmetry is present in your measurements | Keep logging each hand separately |
| Gap changes after the setup changes | The two series are not directly comparable | Start a new baseline with the revised protocol |
Keep the boundary clear. This table interprets measurements, not health. A dynamometer reports force; it does not identify the reason for a lower result or diagnose a condition.
What should you do with a repeatable gap?
Do not turn one number into a rehabilitation plan.
If the gap repeats, keep per-hand records and review what changed in your training or testing. For general strength-programming information, use our separate guide on how to improve grip strength. This article does not prescribe corrective exercise, treatment, or rehabilitation.
That boundary is intentional: the same reading can have different explanations, and a web article cannot determine which one applies to you.
Measure the gap instead of guessing at it
Two-handed sets merge both hands into one result. Per-hand history keeps the comparison visible.
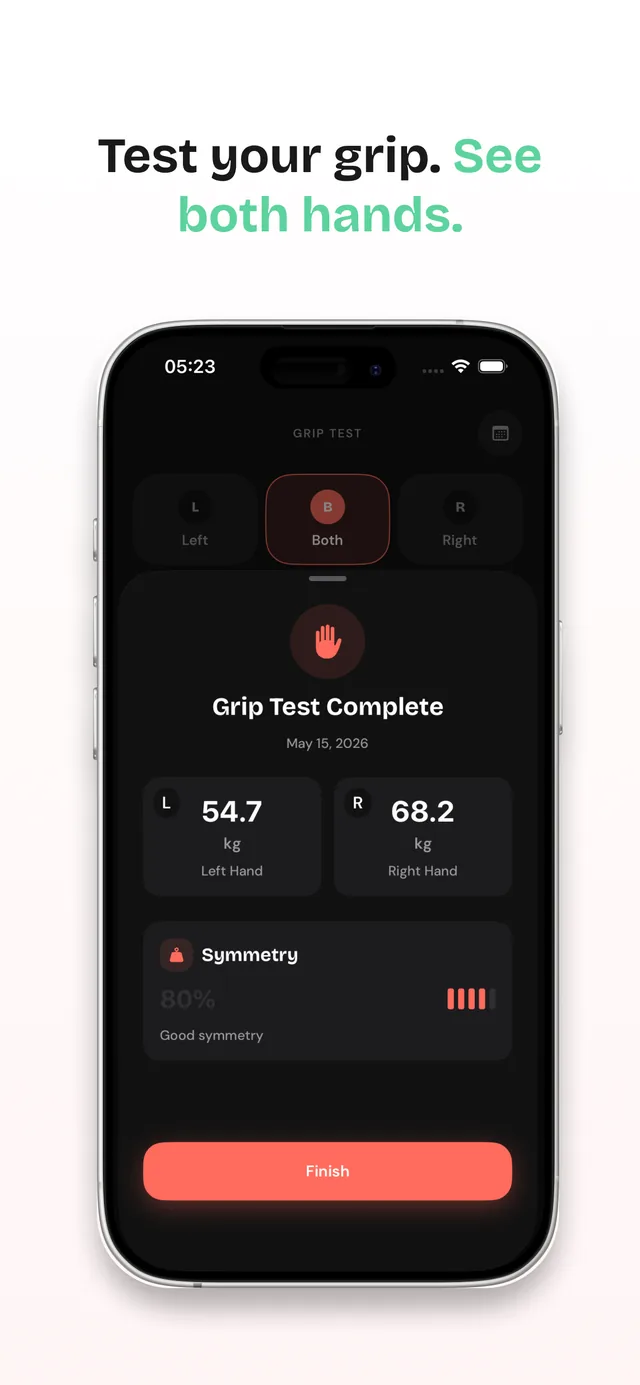
MrGripper lets you enter left and right readings from any dynamometer, stores the hands separately, and reports a left–right symmetry score. There is no Bluetooth pairing: you type in the number from the device you already own. Per-hand workout logging and dynamometer grip tests are available in the free tier.
The useful output is the trend—whether the same hand keeps testing lower and whether the gap is stable or changing under the same protocol.

Measure both hands. Keep the history.
Grip Strength: MrGripper is free on the App Store—log per-hand grip tests and track your symmetry against your own baseline.
Frequently asked questions
Should your dominant hand always be stronger?
No. The dominant hand is stronger on average in pooled research, but not for every person. In one 2025 sample of 229 adults, 32.3% produced their highest reading with the non-dominant hand.
Is a 10% difference between hands normal?
A 10% difference can fall near published group averages, but it is not a universal pass/fail threshold. The 2025 review found an average dominant-hand advantage of 8.1% in grip data, while individual results varied. Repeatability matters more than treating 10% as a verdict.
Can a dynamometer tell me why one hand is weaker?
No. A dynamometer measures force under the conditions of that attempt. It cannot identify the cause of a difference between hands.
Does MrGripper connect to a dynamometer?
No. You read the result from any dynamometer and enter it manually. That is what lets the app work with the device you already own.
Sources
- Grip asymmetry averages and the 87-study synthesis—Foley RCA, et al. A comprehensive scoping review and meta-analysis of upper limb strength asymmetry. Scientific Reports. 2025;15:4636.
- Non-dominant-hand results and the documented test protocol—Leiva-Caro JA, et al. One third of people exert greater handgrip strength with their non-dominant hand. Scientific Reports. 2025.
- Variation across published grip-test protocols—Sousa-Santos AR, Amaral TF. Differences in handgrip strength protocols to identify sarcopenia and frailty—a systematic review. BMC Geriatrics. 2017;17:238.