 MrGripper
The short answer
Across 2.4 million adults in 69 countries, median handgrip strength peaks at ages 30–39 — 49.7 kg for men, 29.7 kg for women — then falls about 5.6 kg (men) and 3.5 kg (women) per decade in later life. Above the median for your age and sex is above average; below the 20th percentile is the usual threshold for "low".
That's the number. The more useful thing this page gives you is the spread — because "average" tells you almost nothing on its own, and the gap between the 20th and 80th percentile at a single age runs 15–17 kg for men.
Grip strength percentile calculator
Enter a dynamometer reading with your age and sex to see roughly where you sit among adults of the same age and sex worldwide.
Your reading is placed on the published percentile ladder for your five-year age group — the same international norms tabulated below (Tomkinson et al., 2025; 2,405,863 adults, 69 countries). Those norms are harmonised to a reference protocol: hydraulic dynamometer, seated, elbow flexed, three squeezes per hand, best result. Test differently and your percentile shifts. Ages under 20 are compared with the 20–24 group, which the source does not cover. Orientation only, not a medical assessment.
What is the average grip strength by age?
The table below is the reference. It comes from a 2025 systematic review in the Journal of Sport and Health Science that pooled 100 observational studies covering 2,405,863 adults aged 20 to 100+ from 69 countries — roughly 71% of the world's population — and statistically harmonised them onto one testing protocol before fitting percentile curves.
P50 is the median: the literal "average grip strength" for that age and sex. P20 and P80 are the thresholds the study's own authors propose for "low" and "high".
| Age | Men (kg) | Women (kg) | ||||
|---|---|---|---|---|---|---|
| P20 | P50 | P80 | P20 | P50 | P80 | |
| 20–24 | 40.5 | 48.0 | 56.0 | 24.0 | 28.6 | 33.6 |
| 25–29 | 42.1 | 49.3 | 56.7 | 24.5 | 29.4 | 34.6 |
| 30–34 | 42.2 | 49.7 | 57.4 | 24.4 | 29.7 | 35.2 |
| 35–39 | 41.5 | 49.5 | 57.5 | 24.1 | 29.7 | 35.4 |
| 40–44 | 40.4 | 48.8 | 57.1 | 23.7 | 29.4 | 35.2 |
| 45–49 | 39.0 | 47.6 | 56.2 | 23.1 | 28.9 | 34.8 |
| 50–54 | 37.4 | 46.2 | 54.8 | 22.4 | 28.2 | 34.0 |
| 55–59 | 35.6 | 44.4 | 53.1 | 21.5 | 27.3 | 33.0 |
| 60–64 | 33.6 | 42.4 | 51.1 | 20.6 | 26.2 | 31.8 |
| 65–69 | 31.5 | 40.1 | 48.8 | 19.5 | 25.0 | 30.5 |
| 70–74 | 29.3 | 37.7 | 46.3 | 18.3 | 23.6 | 28.9 |
| 75–79 | 27.0 | 35.1 | 43.5 | 17.0 | 22.1 | 27.2 |
| 80–84 | 24.5 | 32.3 | 40.5 | 15.5 | 20.4 | 25.3 |
| 85–89 | 21.9 | 29.4 | 37.4 | 13.9 | 18.6 | 23.3 |
| 90–94 | 19.2 | 26.3 | 34.2 | 12.2 | 16.7 | 21.2 |
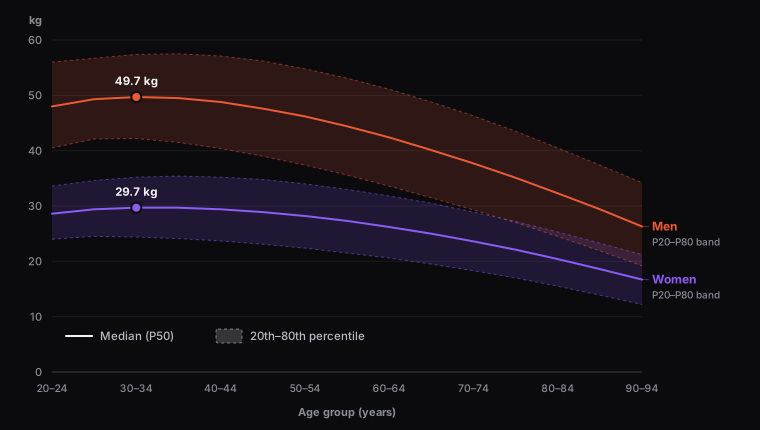
Two things worth noticing before you compare yourself to it.
The spread dwarfs the age effect. A man in his early thirties at the 20th percentile squeezes 42.2 kg; one at the 80th squeezes 57.4 kg. That 15.2 kg gap between two healthy men of the same age is bigger than the 9.6 kg the male median loses across the 35 years from the early thirties to the late sixties. Where you sit in the distribution matters more than which decade you're in.
Early adulthood is flat. Between the early twenties and the late thirties the median rises by just 1.5 kg in men and 1.1 kg in women — the review's authors call the improvement across early adulthood negligible. If you're 27 and expecting to grow into a stronger grip, you won't. You'll have to train for it.
At what age is grip strength highest?
Ages 30–39. Grip is essentially flat from 20 to 39, tops out in the thirties, holds through midlife, then falls at an accelerating rate.
Three large, independent datasets put the peak in the thirties and land within about 3 kg of each other — which, given different countries, decades, and dynamometers, is the strongest single argument that the number is real:
| Dataset | Sample | Peak grip, men | Peak grip, women |
|---|---|---|---|
| International pooled norms, 69 countries | 2,405,863 | 49.7 kg median, ages 30–39 | 29.7 kg median, ages 30–39 |
| 12 British studies (Dodds et al., 2014) | 49,964 | 51.9 kg mean (SD 9.9) at age 32 | 31.4 kg mean (SD 6.1) at age 32 |
| German National Cohort (Bohn et al., 2023) | 200,389 | 52.1 kg mean (SD 9.2) at age 38 | 32.5 kg mean (SD 5.7) at age 39 |
One detail that matters more than it looks: the international figure is a median, the other two are means. Comparing them directly is already the small kind of mismatch the next section is about.
The decline afterwards is not linear. In middle adulthood the pooled norms lose about 2.8 kg per decade for men and 1.4 kg for women; in late adulthood that roughly doubles to 5.6 kg and 3.5 kg per decade. The British data puts the start of that decline as early as the fifth decade.
None of that is a forecast for you. These are cross-sectional snapshots of different people at different ages, not the same people tracked through life — the review's authors say so explicitly, and warn that cohort effects can bias the apparent decline in either direction. Your own repeated measurements are the only data that describe your trajectory.
What counts as a good grip strength?
The authors of the international norms propose a five-band quintile framework, which is a good deal more honest than "45 kg is good":
| Percentile | Label |
|---|---|
| Below P20 | Low |
| P20–P39 | Somewhat low |
| P40–P59 | Moderate |
| P60–P79 | Somewhat high |
| P80 and above | High |
Read your number against the row for your age and sex in the chart above, and that's your answer against the general population.
Three caveats that change the answer completely, depending on why you're asking:
- Against the general population — use the bands. A 34-year-old man at 58 kg is just past the 80th percentile; so is a 34-year-old woman at 36 kg. That's "high".
- Against your sport — population norms are close to meaningless for grip-limited athletes. Climbers, grapplers, and grip-sport competitors routinely test far above the 95th percentile, because the sport selects for it and trains it. The table can't tell you whether your hangboard is progressing.
- Against yourself — the only comparison that responds to training. A grip 10% stronger than three months ago is progress at any percentile.
Why don't any two grip strength charts agree?
Search this topic and you'll find charts that disagree by 5 kg or more for the same age and sex. They're not all wrong. They're measuring different things and mostly not saying so.
Four variables move the number before biology gets a vote:
- The device. Jamar hydraulic, Takei digital, and spring dynamometers do not read alike. The international review had to build regression models just to convert between dynamometer types before it could pool anything.
- Best of three, or mean of three. Clinical practice usually averages three trials; strength testing usually records the best. That difference alone is worth a couple of kilograms, in a predictable direction.
- Which hand. Some studies report dominant vs non-dominant. Some report right vs left regardless of handedness. Some report the best of both. These are three different statistics wearing the same label.
- Posture. Seated with the elbow at 90° is the standard; standing with the arm extended is not, and it reads differently.
Here's the same "average" for men in their thirties, from three real sources:
| Source | Protocol | Men, 30s |
|---|---|---|
| Massy-Westropp et al., 2011 (Australia, n=1,314 men) | Jamar, seated, handle position II, mean of 3, right hand | 47 kg (SD 9.7) |
| Wang et al., 2019 (NHANES, US, n=13,676) | Takei digital, best of 3, dominant hand | 50.3 kg (ages 30–34) |
| Tomkinson et al., 2025 (69 countries, n=2,405,863) | Harmonised: hydraulic, seated, best of 3, both hands | 49.7 kg median (ages 30–34) |
All three are correct. They answer slightly different questions. The practical consequence for you is simple: a chart is only useful if your test protocol matches its protocol, and the moment you compare this month's reading to last month's, protocol consistency matters more than which chart you used. The home testing protocol is where to fix that.
Where does the 27 kg "low grip strength" cut-off come from?
You'll see it everywhere: below 27 kg for men and 16 kg for women counts as low. It's worth knowing exactly where those two numbers came from, because they are more arbitrary than they look.
They're from the 2019 European consensus on sarcopenia (EWGSOP2), whose cut-off table cites the British normative study above. The derivation is one line of arithmetic — 2.5 standard deviations below the young-adult peak mean:
- Men: 51.9 − (2.5 × 9.9) = 27.15 kg → rounded to 27
- Women: 31.4 − (2.5 × 6.1) = 16.15 kg → rounded to 16
That's it. The threshold is a statistical convention borrowed from how osteoporosis is defined, applied to one British dataset, then rounded for ease of use — the consensus authors say as much.
Which is why the "official" number for low grip strength changes with the region:
| Consensus | Men | Women |
|---|---|---|
| EWGSOP2, Europe, 2019 | < 27 kg | < 16 kg |
| AWGS, Asia, 2019 | < 28 kg | < 18 kg |
| German National Cohort–derived, 2023 | < 29 kg | < 18 kg |
A 2 kg shift sounds trivial. In an independent German cohort, applying the higher cut-offs instead of EWGSOP2's classified 1.5 times as many people as having low grip strength — 17.7% versus 11.7%.
These are screening thresholds used by clinicians, not a self-diagnosis. A reading below them means a professional would look further, nothing more. If your number concerns you, that's a conversation with your doctor or physiotherapist, not with a table on the internet.
Is one hand supposed to be stronger than the other?
Usually — but by less than the folklore says, and it depends on your handedness.
The old clinical shorthand is the "10% rule": your dominant hand is about 10% stronger. Across 310 people it holds on average, at 10.74%. Split by handedness it falls apart — right-handers averaged a 12.72% dominant-hand advantage, while left-handers averaged −0.08%, essentially no difference at all (Petersen et al., Am J Occup Ther, 1989).
So if you're left-handed, a 10% gap isn't "normal dominance" — it's an asymmetry. If you're right-handed, a gap in the low teens is unremarkable, but a gap that grows over months is a signal.
Notice that none of the population charts on this page can help you here. The international norms are harmonised to the best result across both hands; the Australian data reports right and left regardless of handedness. Your left–right gap is a number only you can measure, and only if you record each hand separately every time.
There's more to this than one section can hold — including how common large gaps actually are, the point at which a gap starts to matter, and why a single test can't reliably detect a 10% difference at all. Full breakdown: grip strength symmetry and what a normal left–right difference is.
Why your own trend beats any table
A percentile is a single frame. It tells you where you stand today relative to strangers, and it cannot tell you the one thing that actually responds to training: which direction you're moving.
This isn't a marketing position — it's the recommendation in the norms themselves. The review's authors propose tracking repeated measurements against the percentile bands to identify whether change is expected, better than expected, or worse than expected, and point to studies finding that an accelerated loss of grip strength, combined with a low level, carries information a single reading doesn't. In other words: the table's best use is as an axis for your own line, not as a verdict.
Practically, that means three habits:
- Fix your protocol and never change it. Same device, same chair, same elbow angle, same best-of-three-or-mean-of-three convention. A protocol change invents progress that isn't there.
- Record both hands separately. A single blended number destroys the symmetry signal permanently — you can't recover it later.
- Retest every two to four weeks and judge the monthly trend. Grip readings move with fatigue, time of day, and hand temperature. One low test is noise.
For the full protocol, see how to test grip strength at home. To move the number rather than just measure it, start with how to increase grip strength.
Why grip strength gets so much research attention
It's cheap, quick, objective, and it predicts things. In the PURE study of 139,691 adults, each 5 kg lower grip strength was associated with a 16% higher risk of death from any cause (hazard ratio 1.16, 95% CI 1.13–1.20), and grip was a stronger predictor of all-cause and cardiovascular mortality than systolic blood pressure (Leong et al., The Lancet, 2015).
Read that carefully, because it's routinely oversold. It's an association across populations, not a mechanism and not a promise. A strong grip is not a health certificate, and squeezing a dynamometer more is not a longevity intervention. What grip strength is good at is being an easy, repeatable proxy for whole-body strength — which is exactly why it's worth measuring, and exactly why the trend matters more than the snapshot.
Turning a benchmark into a trend with MrGripper
A single reading answers "where am I?". A tracked history answers "is it working?" — and that's the question the percentile chart can't touch.
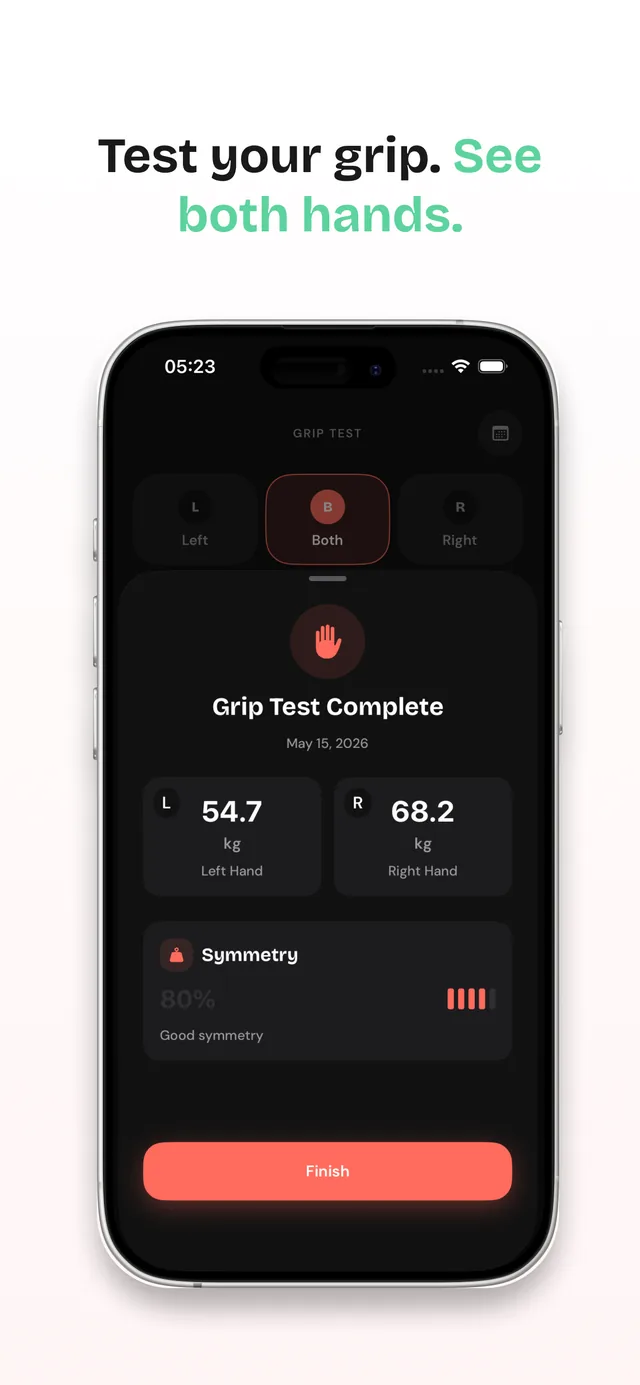
MrGripper's grip-test flow is built for the second question:
- Run a grip test for the left hand, the right hand, or both, and enter your dynamometer readings in kg or lbs. There's no pairing step — you read the number off whatever dynamometer you already own and type it in, which is what lets the app work with any device.
- Each hand's history is kept separate, and the app scores your left–right symmetry as a percentage, so a lagging hand is visible instead of buried in an average.
- Insights chart the trend over weeks, per hand — so a retest every few weeks becomes a progress line, not a note you lose.
It's free on the App Store for iPhone, iPad, Mac, and Apple Vision Pro, with an optional Pro subscription ($4.99/month or $29.99/year) that adds full history, longer insight windows, per-equipment and per-load PRs, and CSV export.

Know your percentile. Then go beat it.
Grip Strength: MrGripper is free on the App Store — log grip tests per hand and watch your trend against your own history.
FAQ
What is the average grip strength by age?
Median handgrip strength peaks at ages 30–39 at 49.7 kg for men and 29.7 kg for women, based on pooled international norms from 2.4 million adults in 69 countries. It's roughly flat from age 20 to 39, then declines — about 2.8 kg per decade for men and 1.4 kg for women through middle age, accelerating to 5.6 kg and 3.5 kg per decade in later life.
What is a good grip strength?
Compare your reading to the percentile row for your age and sex. The international norms' authors classify below the 20th percentile as low, the 40th–59th as moderate, and the 80th percentile or above as high. For a man in his thirties that puts "high" at roughly 57 kg and above; for a woman in her thirties, roughly 35 kg and above.
At what age is grip strength highest?
Ages 30–39. Three independent datasets — pooled international norms, 12 British studies, and the 200,000-person German National Cohort — put the peak between ages 32 and 39, at 49.7–52.1 kg for men and 29.7–32.5 kg for women. Grip is nearly flat from 20 to 39 rather than climbing to a sharp peak.
Is 40 kg a good grip strength?
It depends entirely on age and sex. For a woman in her thirties, 40 kg sits right around the 95th percentile. For a man in his thirties the same reading is below the 20th percentile; for a man in his early seventies it's close to the 60th. This is why a single "good" number doesn't exist.
What grip strength is considered weak?
Clinical screening consensuses set the threshold at under 27 kg for men and 16 kg for women in Europe, under 28 kg and 18 kg in Asia. Those are screening cut-offs that prompt further assessment by a clinician — not a diagnosis, and not meaningful for a healthy young adult, whose reading would sit far above them anyway.
Is one hand normally stronger than the other?
For right-handers, yes — about 12.7% stronger on average. For left-handers, the two hands are typically equal. The often-quoted "10% rule" is an average that hides that split. Track your own left–right gap over time rather than comparing it to a rule of thumb.
Why do grip strength charts disagree with each other?
Because they use different dynamometers, different scoring conventions (best of three versus mean of three), different hands (dominant, right, or best of both), and different postures. Any of these shifts the number by several kilograms. A chart is only meaningful if your test protocol matches the one behind it.
Sources
- The percentile chart, peak values, per-decade decline, and the quintile bands — Tomkinson GR, et al. International norms for adult handgrip strength: a systematic review of data on 2.4 million adults aged 20 to 100+ years from 69 countries and regions. J Sport Health Sci. 2025.
- British life-course norms and the young-adult peak means — Dodds RM, et al. Grip strength across the life course: normative data from twelve British studies. PLoS ONE. 2014;9(12):e113637.
- German National Cohort peaks and derived cut-offs — Bohn L, et al. Grip strength values and cut-off points based on over 200,000 adults of the German National Cohort. Age Ageing. 2023;52(1):afac324.
- The 27 kg / 16 kg cut-offs and their derivation — Cruz-Jentoft AJ, et al. Sarcopenia: revised European consensus on definition and diagnosis (EWGSOP2). Age Ageing. 2019;48:16–31.
- Asian cut-offs — Chen LK, et al. Asian Working Group for Sarcopenia: 2019 consensus update on sarcopenia diagnosis and treatment. J Am Med Dir Assoc. 2020;21(3):300–7.
- Australian Jamar norms — Massy-Westropp NM, et al. Hand grip strength: age and gender stratified normative data in a population-based study. BMC Res Notes. 2011;4:127.
- US NHANES norms — Wang YC, et al. Summary of grip strength measurements obtained in the 2011-2012 and 2013-2014 National Health and Nutrition Examination Surveys. J Hand Ther. 2019;32(4):489–96.
- The 10% rule by handedness — Petersen P, et al. Grip strength and hand dominance: challenging the 10% rule. Am J Occup Ther. 1989;43(7):444–7.
- Mortality association — Leong DP, et al. Prognostic value of grip strength: findings from the Prospective Urban Rural Epidemiology (PURE) study. Lancet. 2015;386(9990):266–73.